In Charts: Global Hunger
A collection of charts, maps and graphs exploring global hunger — in a world that has enough food to feed everyone.
December 31, 2019
Hunger is murder. Together we would have the tools to solve this global challenge.
— Gerd Müller, German Federal Minister for Economic Cooperation and Development
Hunger is measured by the Global Hunger Index (GHI) and – despite advances in fighting hunger – applying the GHI paints a solemn picture of the world in the twenty-first century.
Below is a collection of charts, maps and graphs exploring global hunger, in a world that has enough food to feed everyone.
To go deeper, also browse Global Poverty in Charts by clicking here
How the GHI is calculated

Applying the GHI to the world

The countries affected most by hunger

The cycle of hunger

Global hunger over time

Countries that have made progress tackling hunger

The link between poverty and hunger

The link between food and the environment

How much water it takes to produce food

The link between climate change and global hunger

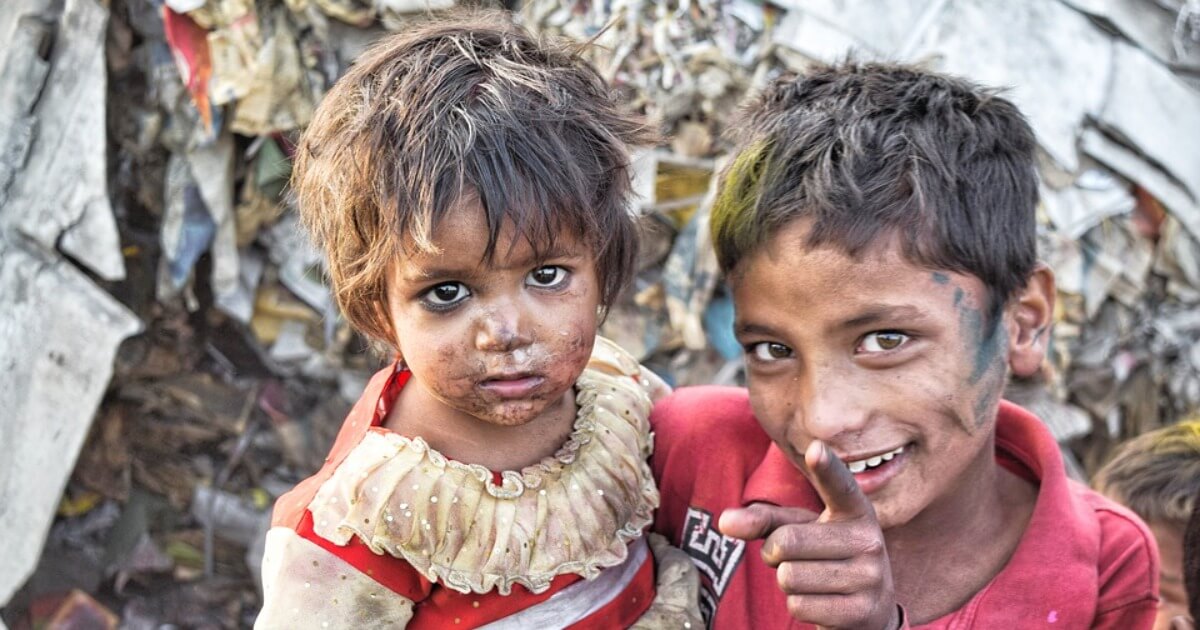
The scourge of child hunger

The anatomy of child hunger

The detrimental effects of stunting in children

Global agricultural productivity

To read the Global Hunger Index click here
Takeaways
A collection of charts, maps and graphs exploring global hunger — in a world that has enough food to feed everyone.